
Price Channel Oscillator. A tool to make pairs trading easier
The task of any trader and investor is to minimize risks as much as possible, but at the same time receive acceptable profitability.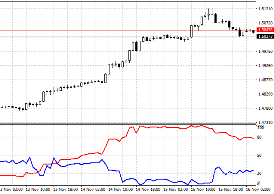
Large hedge funds achieve this goal through smart risk hedging, compiling portfolios of shares and other assets that are as market-neutral as possible, as well as by searching for a direct relationship between assets, their correlation and, most importantly, spread or swap.
However, in pairs trading, everything is far from being as simple as it seems at first glance, because knowing the direct connection between assets, it is necessary to catch the very moment of making a profit due to the spread that occurs at the moment of a strong divergence of charts.
To simplify pairs trading, as well as search for expansion zones for different assets, traders in the vast majority of cases use special assistants; we will get acquainted with one of these assistants in this article.
The Price Channel Oscillator indicator is an auxiliary technical analysis tool, the main task of which is to build a price oscillator based on two currency pairs.
Days of the week indicator
Trading in financial markets, and especially the Forex market, is in one way or another based on search patterns.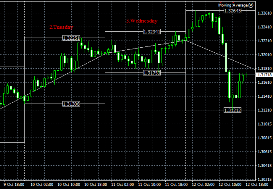
The peculiar appearance of a candle, the intersection of indicator lines, a breakout of a level, opening a position at a certain time of day, and so on - all this is the development of the found patterns.
One of the most obvious patterns is the movement of the price of an asset at certain times of the day, days and even months.
Traders have added the concept of seasonality to some assets, since the price anomalously gains activity during certain months of the year.
However, searching for such patterns takes a lot of effort, so traders resort to auxiliary indicators that make markings on the chart.
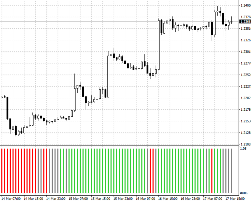
LeMan Variation. Source of market signals
Any trading strategy cannot do without its most important element – a signal indicator.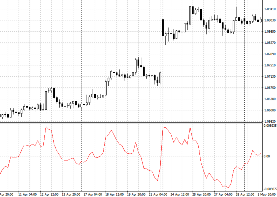
For this role, as a rule, all kinds of oscillators or custom tools based on them are used.
The LeMan Variation indicator is a technical analysis tool that belongs to the category of oscillator indicators.
It is worth noting that the LeMan Variation indicator is a unique development, since in the process of its creation the author did not use standard tools, but implemented his idea from scratch.
Like all indicators belonging to the oscillator group, LeMan Variation can be safely used on absolutely all time frames, and it demonstrates especially high efficiency on small time frames, which are most often used for scalping.
FractPrice indicator
Based on the research of many traders and analysts, the price is in so-called sideways or wide flats almost 70 percent of the time.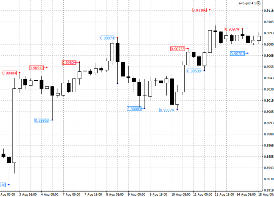
Market activation, as a rule, occurs after the breakdown of the next extreme or support and resistance levels.
One of the first traders who noticed the importance of identifying extreme points and was able to specify the determination process itself by creating his own indicator was Bill Williams.
It was he who introduced the concept of Fractals in the stock and foreign exchange markets, proposing the concept of taking as a basis five candles and the highest point, which, as a rule, is in the middle of the candle combination.
Thanks to the fact that Bill published his own book, in which he revealed the secrets of his trading strategy.
GentorCCI indicator. Multi-tasking forex indicator
Standard indicators are an excellent source of ideas for many traders and programmers who are trying to create technical analysis something new, unique and inimitable.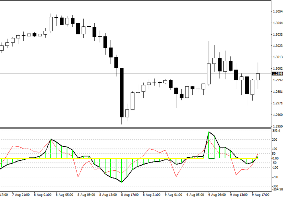
However, it is not always necessary to change standard indicators beyond recognition in order to get something of your own, and sometimes it is enough to take an unconventional approach to their use, and most importantly, their combination.
One of these extremely common approaches when creating non-standard indicators is a combination of oscillators of different periods in one window, which gives a completely new type of signal when they cross.
Actually, in this article you will get acquainted with one of these indicators, the basis for its creation, which was a non-standard approach to using a standard indicator.
Wolfwavesfind indicator
It is no secret that the market has a wave structure. One of the first traders to talk about this more than twenty years ago was Charles Dow.
Now, when there is no need to draw graphs manually, as was previously the case, everyone can be convinced of this.
Any growth is sooner or later accompanied by a fall, and if the size of the waves can be different both in the number of candles and in the dynamics of occurrence, then the general structure of the trend in all markets is almost identical.
It was this pattern that Ralph Elliot first noted when he created his own wave theory of five trend waves and three correction waves.
This theory has found millions of admirers around the world, but as practice has shown, everything is far from being as ideal as described in books.
4PMA indicator. Automatic channel building
Channel strategies are rightfully considered one of the most effective technical analysis tools.
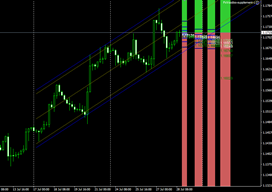
The fact is that the price almost always trades in a certain range, sometimes deviating towards one of the invisible boundaries, sometimes jumping away from it and conquering new extremes.
Thus, the emergence of trading tactics in a channel that represents two strong levels of support and resistance is a common pattern in observing price behavior.
However, while there is no doubt about the effectiveness of using channels to search for market signals, many people have difficulties with independent charting, especially in choosing extreme points, as well as the prices at which these lines are drawn.
Mouteki indicator. Implementation of Thomas DeMark's famous trend line construction
Thomas Demark became famous throughout the world not only for his phenomenal profitability and successful trading,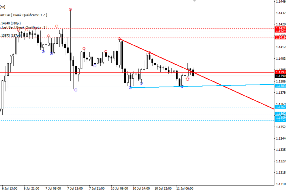
The most interesting thing is that Demark himself never resorted to complex technical analysis techniques in his trading; moreover, he made a huge bias towards the most common trend lines.
However, if traders are still racking their brains about which two extrema to build a line at, Thomas DeMark has specified the rules of construction, creating the concept of a reference point and a clear algorithm for finding them.
It was the specification of Demark's construction rules that allowed programmers to recreate many indicators using his methods, and the Mouteki indicator is one of them.
Multi Info Table. Signals of 12 trading indicators in one window
The indicators that are present by default in the MT4 trading terminal deserve attention, however, such a number of tools cannot be used simultaneously.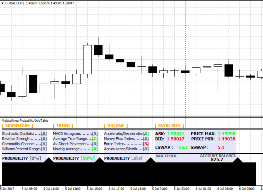
If you apply a large number of indicators to the chart, you will simply lose the ability to fully monitor price movements and plot graphical elements.
In order not to clutter up the working area of the chart, special information indicators were invented; they provide data from multiple indicators simultaneously in the form of a table or panel and do not take up much space on the chart.
The Multi Info Table indicator is a special information indicator that, like a radar, tracks changes in more than 12 standard indicators simultaneously and displays information on the signals that appear to the trader.
Also, in addition to tracking many indicators at the same time, Multi Info Table summarizes their data and displays the probability of price movement as a percentage in one direction or another.
Wolfnen indicator. Automatic construction of Wulf waves
Wave theory, unlike other methods of market analysis, allows you to clearly predict further price movements and build long-term forecasts.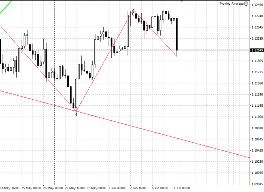
Inspired traders and followers of wave theory created their own approaches, and one of the most popular wave branches became the famous “Wolfe Waves”.
The Wolfnen indicator is a technical analysis tool that allows you to build Wolf waves completely automatically.
It is worth noting that Wolfe waves are equally effective on any time frame that you use.
Since the wave-like structure is present at any time interval. It should also be mentioned that the tool is multi-currency and allows automatic marking not only on currency pairs, but also on CFDs.
Kagi chart indicator
Many traders are daily in search of auxiliary tools that would allow them to discard the so-called market noise in the Forex market.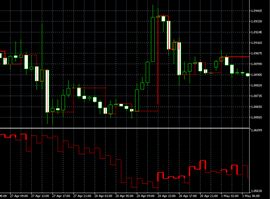
Indeed, the presence of market noise and constant sideways movements manage to confuse even experienced professionals.
The only sure way to get rid of such noise is to decouple the price movement from a time period, and build based on the distance traveled, and not the time frame.
The Kagi chart indicator is a technical analysis tool that allows you to untie price movement from a time period and build the famous Kagi chart based on the price ranges passed through.
It is worth noting that the Kagi indicator makes its construction both directly on the price chart and below it in the form of a separate line.
Woodies CCI indicator
Standard indicators are the most popular tools technical analysis in the forex market.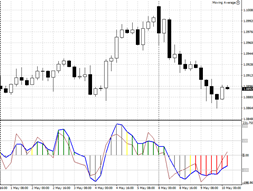
However, as they gain experience and knowledge, sooner or later each more experienced trader begins to doubt their information content and effectiveness.
This is caused simply by the fact that each trader develops his own view of the market, his own ideas and developments.
Standard indicators reflected the idea of those traders who created these tools.
The lack of information content and self-realization of the trader leads to the fact that already popular standard indicators are constantly improved, refined and modified beyond recognition.
Arun indicator.
Price movement occurs only due to the actions of two categories of traders in the market, who form supply and demand.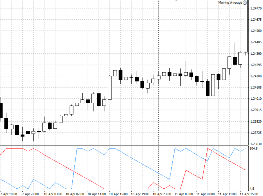
Buyers actively open purchase transactions, thereby creating demand, and sellers place warrants for sale, increasing the supply of currency in the forex market.
It is the predominance of one category or another in the market that forms the main trend in the direction of which it is customary to open transactions.
That is why in the process of market analysis it is very important to determine the dominant crowd, and it is very important to consider the category of sellers and buyers both simultaneously and separately.
This can be achieved only in two ways, namely by reading the Depth of Market tape, which is impossible in the Forex market, or by using technical indicators.
One such indicator that tracks both buyers and sellers in the market is Arun.
Breakout Panca indicator. We trade morning flat
Any currency pair has its own time zones of activity. This is caused by the banal presence of trade forex sessions, which arose due to the fact that traders from different countries trade at completely different times of the day.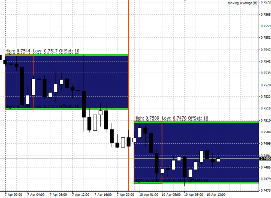
Thanks to this feature, certain patterns emerge in the market. For example, the market is always in a very narrow trading range during the Asian trading session, which usually takes place at night and early in the morning.
This is due to the fact that Europeans and Americans are simply sleeping at this time of day, while eastern countries are holding their auctions.
The created range of the Asian trading session is a kind of reference point for many traders, and a breakthrough of one of the range boundaries is an indicator that shows in which direction the market will move throughout the day.
The Breakout Panca indicator is a technical analysis tool whose main task is to visually outline the morning range for the trader. flatA.
BB Trend Flat. Flat detection in seconds
Trading financial assets always involves building positions in the direction of a certain trend.
However, the market is not so straightforward as we would like this, but it is characteristic of ranging movements, accumulations and the departure of price in the so -called Flet for Forex .
The state of Flet for most trend strategies is comparable to losses, since the price can plunge the trader’s protective order many times, and the repeated entrance to the market from almost the same point makes the trader constantly review his signals.
Once in the Flamp saw, the strategy can give a huge number of false signals, and in the best case, the position will simply hang out in place with a changeable profit, accumulating a negative swap.
In order not to fall into such a situation, it is necessary to correctly determine the flat, and in this a special BB Trend Flat indicator will help us.
Collection of indicators from InstaForex
Technical analysis It is very difficult to imagine without the use of various Forex indicators, because otherwise, without measuring any technical characteristics, the price analysis itself simply would not exist.
Naturally, for effective trading, a trader needs to competently combine technical indicators with each other, since each of them has both strengths and weaknesses, which allows them to compensate for each other’s shortcomings.
Today, on the Internet you can find thousands of different orphan indicators, for which there are no practical instructions for use, not to mention a description of the basis on which the instrument was built.
Such chaos and abundance of instruments leads to the fact that even an experienced market participant begins to build his strategies on something that is not clear, which naturally leads to disastrous consequences and loss of the deposit.
Chaos reversal indicator
The market has extremely unpredictable behavior, and price movements are more reminiscent of chaos than the well-known phase of a trend or flat.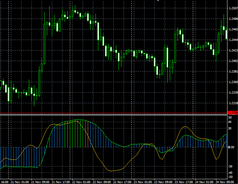
Unfortunately, or maybe fortunately, it is its unpredictability and chaotic movement that allows millions of traders around the world to make money.
Just imagine if the market did not have a chaotic price movement with a tendency towards a certain trend, but a clear directional trend that everyone could determine.
In this case, no one would be able to make money, since in financial markets they only make money when everyone else loses.
Indicator - three screens
The appearance of the famous strategy “Elder's Three Screens” made a kind of revolution in the field of technical analysis.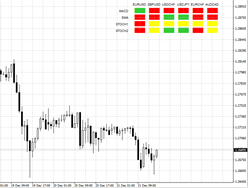
If previously traders could only occasionally view what was happening on higher time frames, then thanks to the principles set out in the strategy, the number of signals opened against the trend has significantly decreased.
Actually, the fundamental principle of the strategy was to measure the trend and direction of the trend on higher time frames, and enter the market directly based on signals from the lower one and always towards the higher time frame.
SpearmanRankCorr indicator
Today, there are dozens of different approaches to market analysis and thousands of indicators based on them.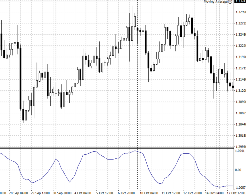
However, almost all technical indicators have one thing in common - an orientation towards statistics.
One way or another, when using any signal tool, we hope that the situation that previously occurred on the chart will repeat itself again.
Despite this, mathematical and statistical approaches are susceptible to unhealthy criticism from traders.
At the same time, almost no one disputes the graphical analysis (http://time-forex.com/tehanaliz/graf-analiz).
The SpearmanRankCorr indicator is a technical analysis tool that is based on complex mathematical calculations. The basis for constructing the SpearmanRankCorr indicator was the Spearman rank correlation coefficient, which was embodied in the form of a smoothed oscillator.
Spearman indicator
Traders who often criticize technical indicators and refuse to use them, pointing out that they are not based on an effective algorithm.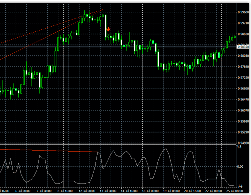
Also critics technical analysis argue that indicators use historical price in their calculations, so the signals will always be lagging.
The development of Forex trading has given rise to the creation of thousands of ridiculous tools that look rather colorful and have no practical use, but not all indicators are as toothless as critics make them out to be.
For example, the Spearman indicator contains a complex mathematical formula that is designed to search for rank correlation.
Pattern Recognition indicator
The use of candlestick patterns began long before the advent of online stock trading. The art of candlestick analysis in European and American markets appeared quite recently, and if it weren’t for Steve Neeson, who accidentally came across a Japanese brochure, perhaps trading would still have been carried out purely on line charts.
However, with the advent of Japanese candlestick analysis in the lives of traders, the trading of many has changed, because, unlike indicator strategies, Japanese candlesticks give signals that are never late.
This is due to the fact that the price is the main source of signals when forex technical indicators they just make calculations based on it.
However, despite all the advantages of using candlestick analysis, there is one huge drawback - the subjectivity of the trader.
Unfortunately, traders tend to see what is not there in reality, not to mention the fact that in many cases this or that figure is used incorrectly.